Supply and Demand.
Supply and Demand is one of the small important parts in a concepts of economic, as it represent a important part of the market economy. Demand refer to the amount of product production or service that is desired to the buyers. The quantity demanded is about the amount of product that people are willing to spend on at a certain price, between both demand and quantity demanded relationship is known as demand relationship. Supply basically shows how much can the market offer. Quantity supplied usually refers to the quantity of the goods producers are willing to supply when receiving at a demand price. Price is usually the impact on supply and demand. The four basic laws of Supply and Demand:
1. The demand increases and supply remain unchanged, a shortage occurs, leading to higher equilibrium price.
2. The demand decreases and supply remains unchanged, a surplus occurs, leading to a lower equilibrium price.
3. The demand remains unchanged and supply increases, a surplus occurs, leading to a lower equilibrium price.
4. The demand remains unchanged and supply decrease, a shortage occurs, leading to a higher equilibrium price.
The Law of Demand
The law of demand state is that if all the other remains equal, and the price of a good is high, less people will demand that good. As the price of a good goes down, the quantity of that good will be more demanded at the market. To put it simple and short, it basically means that, the higher the price, the lower the quantity demanded. Lets say the amount of a good that buyers are willing to purchase at a high price is less is because as the price of the good goes up, the opportunity cost of that good goes up as well. Therefore, as a result, people will naturally will avoid buying expensive thing and will also force them to get something else which they think values more.
As you can see at the chart: A, B and C are the point on the demand curve. On the chart the Price will be represented as P and the quantity demanded will represented as Q. Lets start of at point A, At the price of P1, the quantity of that good demanded is Q1 Say if the price of goods were decreased to P2, the quantity of that good will increase to Q2 which is point B. Same goes to P3 if the price decreases, the quantity will be increased to Q3. When the price goes up or down, the quantity demanded will do the same thing by moving up or down. Therefore, higher the price of good the lower the quantity demanded on the market and the lower the price, the more the good is valued and demanded on the market.
As you can see at the chart: A, B and C are the point on the demand curve. On the chart the Price will be represented as P and the quantity demanded will represented as Q. Lets start of at point A, At the price of P1, the quantity of that good demanded is Q1 Say if the price of goods were decreased to P2, the quantity of that good will increase to Q2 which is point B. Same goes to P3 if the price decreases, the quantity will be increased to Q3. When the price goes up or down, the quantity demanded will do the same thing by moving up or down. Therefore, higher the price of good the lower the quantity demanded on the market and the lower the price, the more the good is valued and demanded on the market.
The Law of Supply
Similar to the Law of Demand, the law of supply shows the quantities that will be sold at a certain price.The supply relationship goes up. If a price rises for a product, suppliers are willing to supply more. Basically means that higher the price, the higher of quantity are supplied.
As the chart shows A, B and C are the supply curves. On the chart the Price will be represented as P and the quantity demanded will represented as Q. As you can see that as the price shifts from P1 to P2, the amount of quantity supplied also shifts to Q1 to Q2. The price movement whether it is up or down cause the movement of the supply curve and the quantity demanded will change according to the changes.
As the chart shows A, B and C are the supply curves. On the chart the Price will be represented as P and the quantity demanded will represented as Q. As you can see that as the price shifts from P1 to P2, the amount of quantity supplied also shifts to Q1 to Q2. The price movement whether it is up or down cause the movement of the supply curve and the quantity demanded will change according to the changes.
Supply and Demand Relationship
Now that we know the laws of both supply and demand, here is an example to show how the laws of supply and demand affect of pricing the goods.
Lets said that a special edition Kobe Bryant shoe was sold for 300 dollars. Old analysis indicates that consumers will not demand shoes for more than 300 dollars, therefor only 30 shoes were made because of the opportunity cost is too high for the suppliers to produce more. Say that the shoes are demanded by 60 people, the price of the shoe will subsequently increases because as according to the demand relationship, as the demand increases, the price will do the same. Same goes to the supply, as the price increases it should increase the amount of shoes supplied according to the supply of relationship; higher the price, higher the quantity supplied.
However if there is 30 shoes were produced and the demand was 20, the price of the goods will not be pushed up because the supply is more than demand. Even after if the consumers have been happy with the goods of the shoe, the price of the leftovers shoes might drop over time as the company of the shoe wants to sell the remaining. This will allow the shoe to be available for those who thought that the opportunity cost was to high.
Equilibrium
When both supply and demand are equal it is called equilibrium. At this very point, the good are at its most efficient because the good being supplied is exactly the same as the good being demanded. You'll just need to find the mid-point of both supply and demand curve. The equilibrium, helps suppliers to sell all the goods that they have produced and helps the consumers to get the goods that they are demanding.
As you can take a look at the chart, the equilibrium happens at the mid-point of both demand and supply curve, with a indication of not inefficiency.
As you can take a look at the chart, the equilibrium happens at the mid-point of both demand and supply curve, with a indication of not inefficiency.
Disequilibrium
Disequilibrium it is the exact opposite of equilibrium, where price or quantity are not equal.
Excess Supply
There will be inefficiency, due to excess of supply that are created within the economy, only if the price is set too high.
As you can look at the chart, at the price at P1 the producers wants to supply the quantity of goods at Q2. At P1, however the consumer want to only consume the quantities at Q1 which is much less than Q2. Since Q2 is much more than Q1, alot of good are being produced and only little amount are being consumed. The only reason the suppliers want to produce more good its that they want to sell to increase their profit. But the consumers will find that the product is less attractive and purchase less due to high price.
Excess Demand
Excess demand is create when the price are set below the equilibrium. Due to low price, there will be a lot of consumers wanting that product and while they are wanting it producers are nor making enough for the consumers.
In such situation, as you can see at the chart. At the price of P1 the quantity of demanded goods by consumers is at Q2. The amount of goods that the producers are willing to make is at Q1. This shows that there are too little good are produced to the want of the consumers. However, the price will go up because of the consumers wanting the good and they have to compete with one another to get the good at the certain price, this also will make suppliers to supply more and it will slowly bring the price closer to the equilibrium.
Shifts vs. Movement
Movement
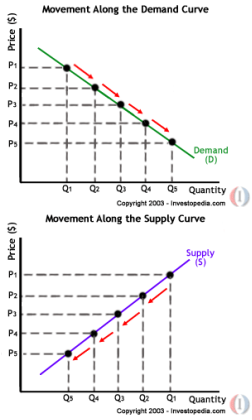
Movement is usually refers to the change on the curve. Movement shows a change in both price and quantity demanded. Movement helps to keep the demand consistent. Therefore, price of the good changes and the quantity demanded changed. A movement basically occurs when change in quantity is only caused by the change of price.
A movement on the supply curve is the same as demand to keep the relationship consistent. Supply curve will occur when the goods of the price changes and the original supply changes to the amount of quantity supplied. A movement basically occurs when change in quantity supplied which is only cause by the price.
Shift
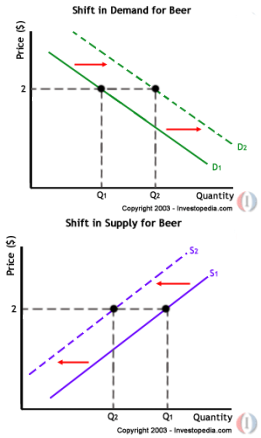
A shift is taken place on the supply or demand curve, and it occurs when good’s quantity or supplied changes and the price still remains the same. Let’s take coke bottle for an example, a coke bottle is sold for a price for 3 dollars and the demanded quantity of coke bottle increases to Q2 from Q1, so then there will be a shift in demand for coke bottles. This means that the quantity of demand is affected by a factor other than price. For instance coke was the only soft drink that was available in Malaysia. More quantities but at the same price.
Same goes to shift in supply, lets still use coke bottle for example. If it cost 2 3 dollars and the quantity supplied was decreased from Q1 to Q2, then you are able to see the shift in the supply of coke bottles. The quantity supplied affected by a factor other than price. For instance if one of the machines had problems and it will take a while to get a new one, due to this coke manufactures would have to force to supply less coke bottle for the same cost/price.
Same goes to shift in supply, lets still use coke bottle for example. If it cost 2 3 dollars and the quantity supplied was decreased from Q1 to Q2, then you are able to see the shift in the supply of coke bottles. The quantity supplied affected by a factor other than price. For instance if one of the machines had problems and it will take a while to get a new one, due to this coke manufactures would have to force to supply less coke bottle for the same cost/price.
Source
"Economics Basics: Supply and Demand." Investopedia – Educating the World about Finance. N.p., n.d. Web. 11 Jan. 2013.
